Kubernetes History Inspector
Copy as Markdown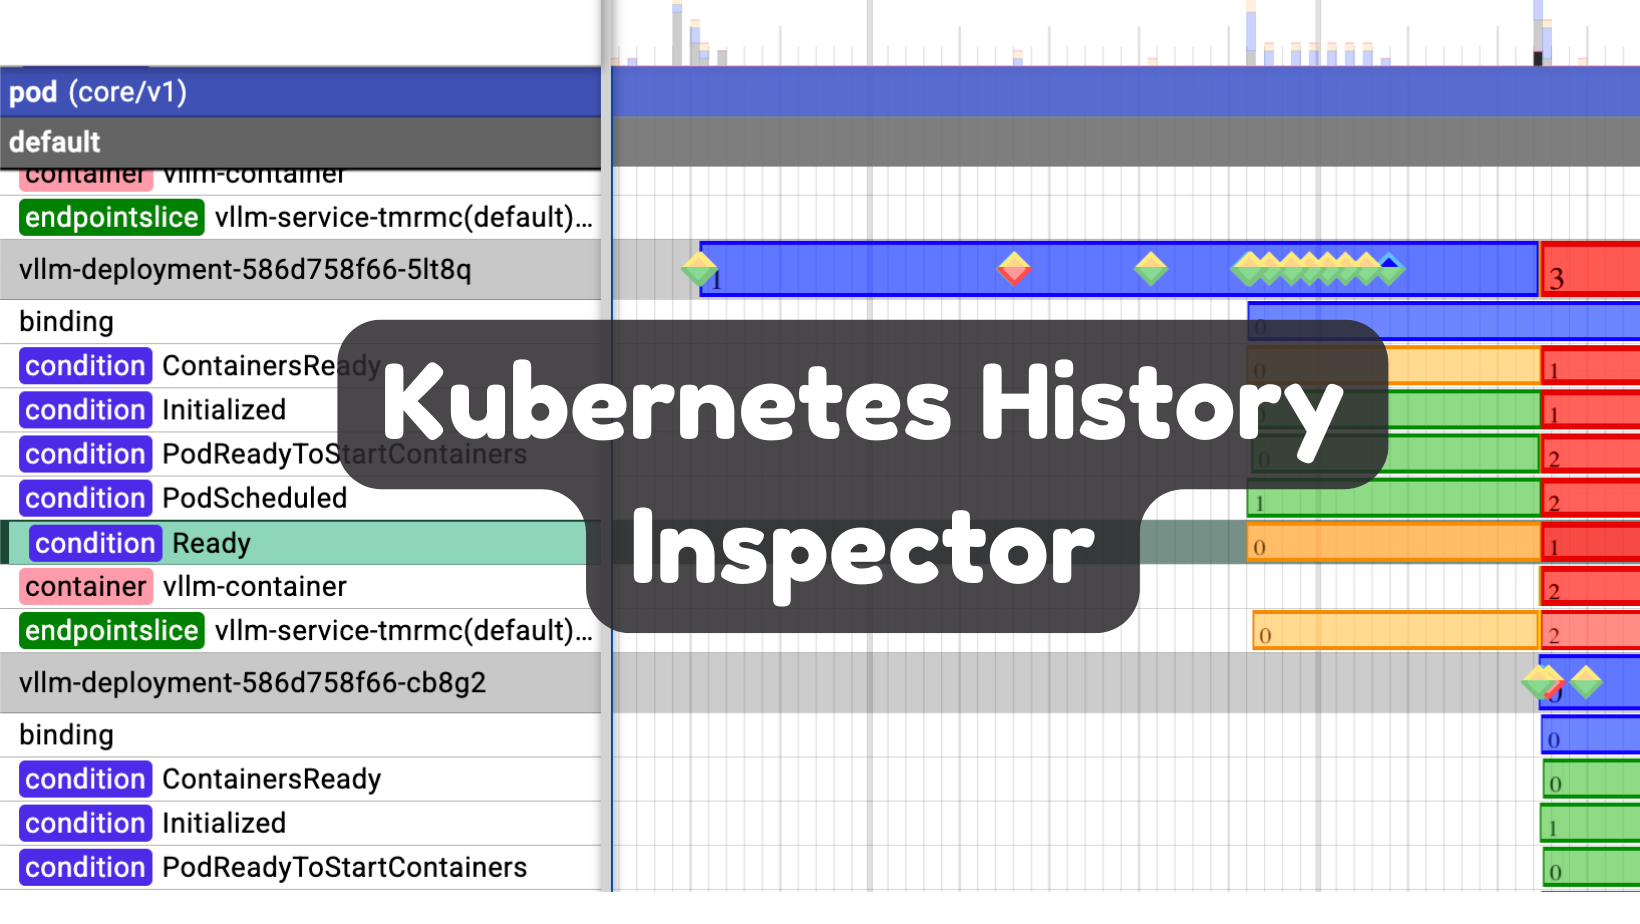
GKE users get access to an awesome new tool this week: the Kubernetes History Inspector. This product, released as open source, parses Kubernetes and GKE logs to generate a timeline with all events in the cluster.
Kubernetes is a complicated system with multiple objects, and various automated processes. A single Deployment results in at least 3 objects: the Deployment, ReplicaSet (one for each app version), and Pods (one for each replica). Nodes come and go. Pods may fail and be re-created. Horizontal Pod Autoscaling might add and remove Pods, etc, etc. Kubernetes History Inspector enables you to view all the interactions of this system with a single pane of glass. Brilliant.
Check out this view showing the lifecycle of Pods in a Deployment:

What I love about this UI is that it’s information dense. The recent trend in UI design is to create simple, clean, plain designs focused on usability and simplicity. But sometimes, as a practitioner you just want to see all the data on one screen. KHI does that, and it feels like you’re more in command of the whole setup. At least to me.
Here’s a quickstart.
- From an environment already authenticated with gcloud (including, Cloud Shell), run
docker run -p 8080:8080 asia.gcr.io/kubernetes-history-inspector/release:latest -access-token=`gcloud auth print-access-token`
2. Browse to http://localhost:8080 (if using CloudShell, tap the “Web Preview” icon, i.e. this one  ).
).
3. Select “New Inspection” -> “GKE” -> “Next” (you can safely leave everything as default for now)
4. Enter your project id. You can find this in the address bar at console.cloud.google.com. E.g. for me, when viewing clusters my URL is https://console.cloud.google.com/kubernetes/list/overview?project=gke-autopilot-test&cloudshell=true so my project id is gke-autopilot-test.
5. Select your cluster (it should auto-populate).
6. Decide your date range. You do this by specifying the end-time, and the duration. KHI will inspect your logs for the given duration up to your specified end-time.
Hit “Run”
Tip: How to determine your time range
KHI is designed for incident investigation and root-cause-analysis. Let’s say you’re trying to figure out something that happened around 3pm. Plug in the latest possible time the incident might have happened (say 3:30pm to allow some buffer), and the duration (say 3h to be safe). KHI will then process all your logs from that time range, and present it to you for analysis and inspection.
The log processing takes a moment, and the UI uses WebGL and renders everything locally, which is all a bit processor-intensive, that’s why this you need to specify defined bounds. With a powerful computer, you can perform analysis on longer time periods.
If you find yourself needing events outside the range, no worries—just hit “Menu” and create a new inspection for a different time period.
The processed inspection data is saved, so you can view it again without the preprocessing step, and there’s an option to download it to keep a record and/or share with others. This can be useful, especially if you’re dealing with logs that may expire after a while.
So that’s Kubernetes History Inspector!